30-second summary:
- Data-driven content lends credibility and authority to your brand.
- Existing public data sources offer a great starting point for implementing a data-driven content strategy.
- While they may initially require more heavy-lifting to find and parse through, public data sets offer endless content possibilities.
- Fractl’s Project Manager Claire Cole shares strategies for creating original, compelling content from data available to anyone.
The key to creating newsworthy content that captures the attention of audiences is to focus on data collection, analysis, and illustration.
This content strategy allows you to take something convoluted and present it to readers in a compelling manner in a way that hasn’t been done before.
While data can be an intimidating medium to work with, it doesn’t have to be.
In this article, I’ll explain how you can use data that’s already out there to create your own newsworthy content and drive engagement.
Where to find public data
What can deter marketers and content creators from working with existing data is not knowing where to find the data they want. It’s true that few organizations and entities broadcast the existence of the data they release, so you need to know where to look.
To start, here are some government agency sources we’ve relied on:

All of these sources include a multitude of variables to dissect in many different ways. Don’t settle for just looking at the top-level data. Consider how you can explore particular angles to reveal new, specific insights.
Take the American Community Survey by the U.S. Census Bureau, for example. Beyond standard demographics you’d expect from a nationwide survey like gender, age, employment status, and earnings, this existing data set features less obvious subjects like fertility, usage of food stamps/SNAP, and health insurance coverage, among many others.
If an entity that might already have public data on the subject you’re interested in doesn’t come immediately to mind, there are other general sources that can be worth a look.
The website FiveThirtyEight, while an outlet built on creating original works of data journalism, often makes the existing data they use in their pieces open to the public, meaning you could find a new angle to explore that they didn’t.
Kaggle and Google Public Datasets are other good platforms for finding a variety of data for use.
Top three ways to create content from existing data
Let’s say you’ve found a public data source. It involves a lot of data, so you have many angles and stats to explore, and the topic can be tied back to your brand.
However, you’re having trouble creating a narrative around all the numbers and decimals and demographics. Here are three strategies to consider when trying to tell a story with data.
1. Consider the implications of time
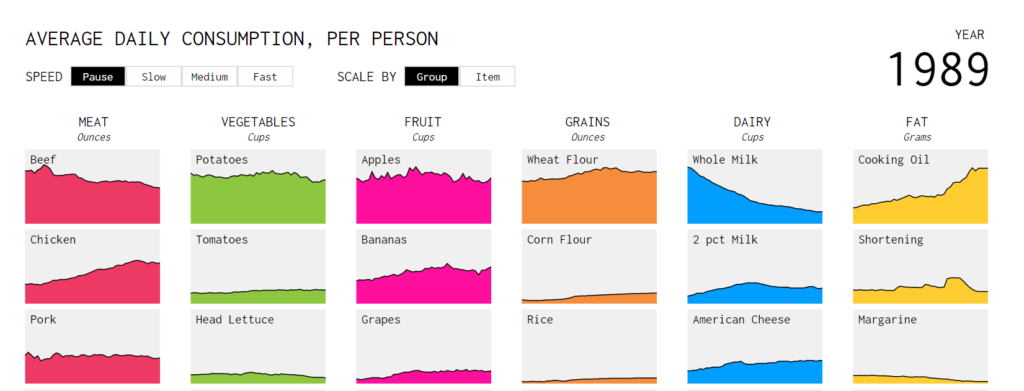
One of the simplest ways to find interesting takeaways within a data set and create a narrative arc is to compare how variables change (or don’t) over time. Nathan Yau created a project for Flowing Data looking at how the American diet has changed over the years.

The project uses data from the Department of Agriculture’s Food Availability Data System, which keeps numbers on food production as well as American consumption.
While insights can be derived from a single year of this data, the power of the project comes from looking at trends over a long period of time.
Adding a time element to data content may not seem groundbreaking, but it can be overlooked when hunting for takeaways. Data doesn’t exist in a vacuum, so putting it into context with a time element can make for a compelling story.
2. Look for interesting demographics to drive the narrative
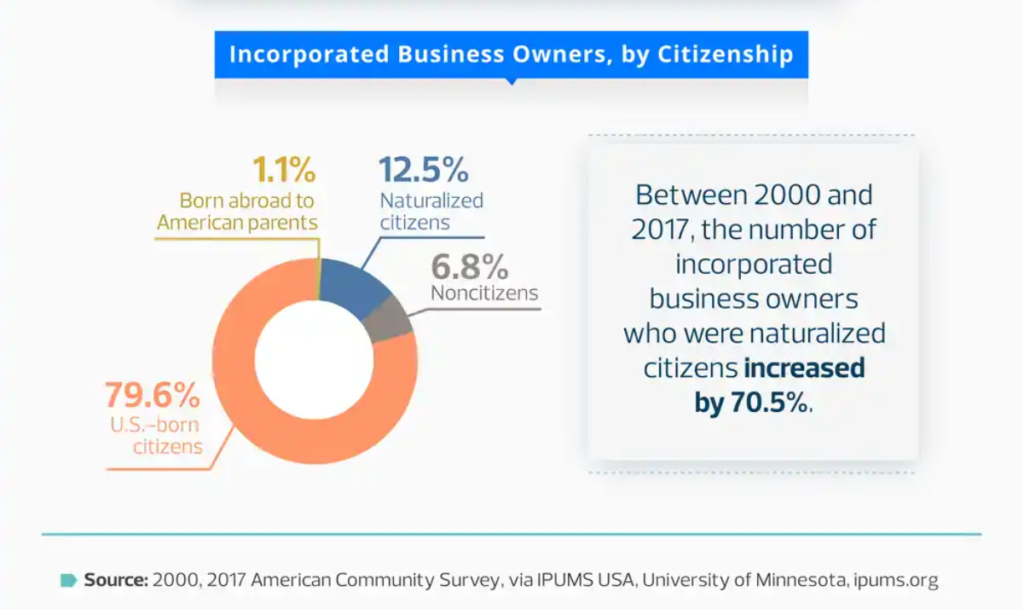
Sometimes finding an interesting or unusual demographic to build content around can help focus data from an existing source. We did this with a project for our client FundRocket, which was about small businesses, a very common topic.
What set the project apart, though, was that it compared small businesses owned by US-born citizens and naturalized citizens.

Using data from the American Community Survey, we compared the two demographics across a number of variables: top industries, fastest-growing industries, metropolitan areas with the most businesses owned by naturalized citizens, and more.
The use of this unique demographic comparison makes the project stand out among other content produced around small businesses.
Look at how Business News Daily not only covered the project but included key takeaways at the top of the article.

When analyzing your data, always visualize what insights a publisher might take away from the project. If you’re able to come up with a few key points, that means you’re on the right track to creating a compelling project. (It also helps you maintain focus as you continue working on it.)
3. Consider a common topic from an uncommon angle
Asking the right questions of your data can lead to compelling findings. A great way to create unique data-focused content is to explore a common topic from an uncommon angle or point of view.
For example, perhaps there’s a topic in your niche that is discussed a lot but never in conjunction with data. Or perhaps a topic generally framed with data could have new life breathed into it by tapping a different data source or metric.
We took this approach for our client The Interview Guys with a project that looked at the occupations that require the most and least work experience.
Work experience is an incredibly common topic in the career and HR spheres. There are articles on everything from how to framework experience on a resume to whether companies are expecting too much of entry-level candidates these days. With all of that competing content, it can be difficult to breakthrough.
Thankfully, data can give us a leg up over other content. In the case of The Interview Guys, their project was differentiated because we took that topic and married it with public data from the U.S. Bureau of Labor Statistics’ Occupational Requirement Survey and Wage Estimates.

This gave the project the added authority of government data while still answering practical questions job seekers and people considering a job change may have, and it was compelling enough to earn media coverage on CNBC.
Building a data-driven content strategy
Creating content around data doesn’t have to be intimidating. There are plenty of publicly available data sources that can be tapped and used to great effect in a diverse content strategy.
Considering data trends over time, seeking out unique demographics to examine, and brainstorming how data can create new angles to a common topic are easy ways to get started building content around data that already exists.
Claire Cole is Project Manager at Fractl, creating data-driven campaigns in a variety of verticals to meet client goals. When she’s not poring over spreadsheets and data visualizations, she’s reading the latest bestseller while snuggled up with her rescue pup, Penny. She can be found on Twitter @claire_cole18.
